OK, so what do all these benchmarks mean, and what are their limitations?
First, the Shootout was run on my laptop sundance, a T42 Thinkpad. Because I wanted somewhat repeatable results, I tried to only run the tests when my laptop wasn't especially loaded -- mostly, at night when I was asleep. This put a practical limit on the lengths of the tests -- I wasn't going to run any test that took, at a run, 8 hours or more. Additionally, my laptop starts playing music to wake me up; this could cause weird slowdowns at certain points in the tests.
Second, each test acts on a vastly simplified model of actual project usage. The numbers may not correspond to the runtimes of any particular project, but should hopefully provide you with some hard data on how a VCS runs under certain idealized circumstances.
Third, these numbers and data are dated as soon as they are published. Even while running the tests, new versions of bzr, git, and monotone have been released. Upgrading would mean rerunning tests for that VCS, which isn't something I really want to do, so the versions tested are a bit old.
It will help to understand that a VCS can be either snapshot-based or changeset-based. bzr, git, and svn are snapshot-based. darcs and hg are changeset-based. mtn is weird, and I don't know about cdv.
Things I have yet to understand
"Banding" in some results? For instance, in the commit-time-vs-files addtime column. What does this signify, if anything?
The tests themselves
commit-time-vs-commits
I started with a first simple test, commit-time-vs-commits, which I eventually abandoned. (It is now subsumed in the access-revision-time-vs-commits test.) This test runs a number of commits, let's say 1000, on a one-file repository. Each commit, we change the file. We measure how long it takes to perform the commit operation.
I expected this to be a sanity check, a very straightforward test with very straightforward results -- each commit should be constant time. For example, to create a revision, Monotone generates a revision file, as described in the Historical records chapter. The length of this file does not change over time -- only one file is changed, no files are added -- so running it through SHA1 should be constant time. Retrieving the old revision head should be constant-time too. Yet Monotone has a steadily increasing runtime for each commit.
More interesting than that, however, is Subversion's behavior! It takes a decreasing amount of time with more commits. I cannot explain this behavior at all.
Codeville performed interestingly too, starting at about 1.2 sec, dropping to about 0.95 sec, and then climbing to 11 sec before I killed it.
access-revision-time-vs-commits
I expanded this test into the access-revision-time-vs-commits test, which also sees how long it takes to retrieve old revisions' data. The access-revision-time-vs-commits test keeps track of all the revision identifiers, and after each commit, does a diff against several (these are the "difftime0".."difftime4" values). These revisions are the quartiles of the revision history: difftime0 is done against the first revision, difftime1 is done against the revision 1/4 of the way from the first and the current, difftime2 is done against the revision 1/2 of the way from the first to the curent, etc., and difftime4 is done against the current revision. Also, the state of the repository (i.e. the one file) is fetched from that revision (the "dumptime0".."dumptime4" columns). The reason many revisions are chosen is because I was concerned that "keyframes" would be taken, and wanted a test that would expose the systems at their weakest.
There's also the lctime column, which is the time that it took to get the most recent revision identifier. The output of the VCS is parsed by the Shootout (and done differently for different systems), and so comparisons between systems is probably meaningless. The reason I saved this information was because I wanted to understand why some systems took so long to run this test.
> source("plot-all-data.R")
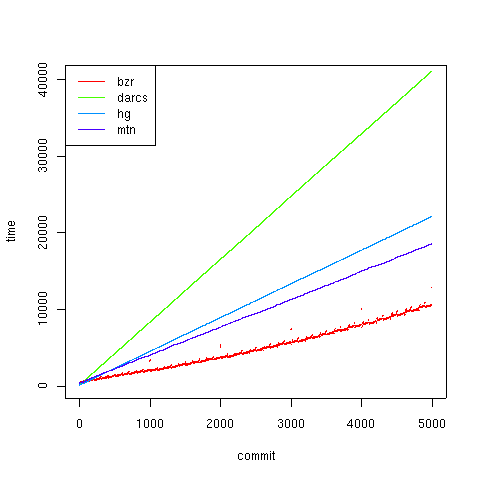
> plot.all.data('access-revision-time-vs-commits-5000', 'committime', \
exclude=c("git-advance", "darcs-hash", "bzr-quiet"))
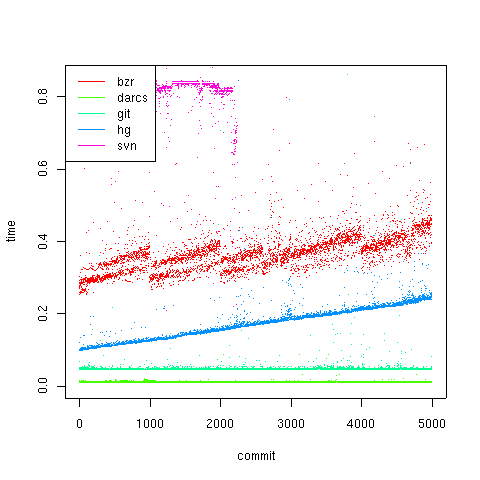
Codeville failed this test too, but not because of the commit times -- mostly it was because of the accessing history.
A rough ordering is as follows: darcs, git, hg, bzr, svn, mtn, cdv.
If you look at the disk usage, though:
> plot.all.data('access-revision-time-vs-commits-5000', 'diskusage', \
      exclude=c("git-advance", "darcs-hash", "bzr-quiet"))
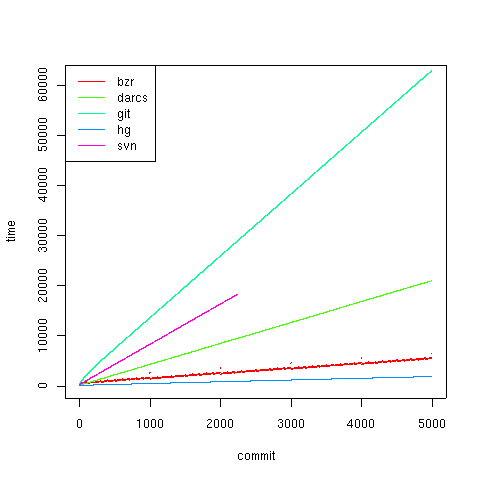
You can see that git buys its speed in disk usage, going up as high as 60 MB. By comparison, the clear winner here is hg, which doesn't get up to 5 MB. Codeville's behavior is interesting here; unlike the other systems, which start at 0 or nearly so, CDV starts at 10 MB, and then increases slowly.
A rough ordering would be: hg, bzr, cdv, mtn, darcs, svn, git.
Depending on your priorities, you may also be concerned with history access time.
> plot.all.data("access-revision-time-vs-commits-5000", "difftime0")
> plot.all.data("access-revision-time-vs-commits-5000", "dumptime0")
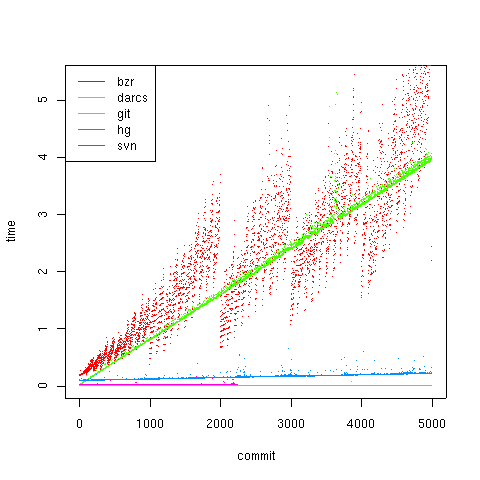
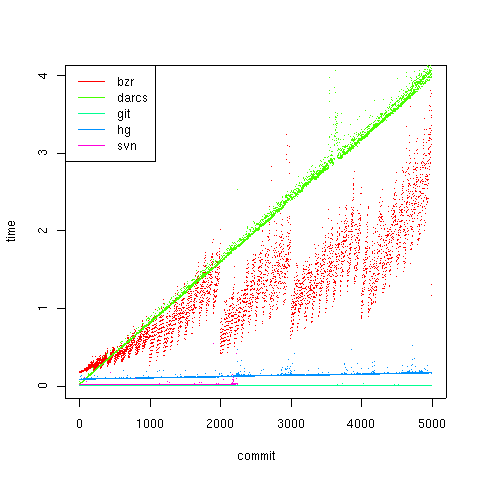
As you can see, seeking through the revision history becomes increasingly costly for most systems -- exceptionally so for bzr and darcs. Note, however, that Subversion and Git both have pretty constant access time for accessing history. This is due to the structure ofsvn and git repositories: they are databases constructed in a directory, with the filename also the revision identifier. Accessing the content of a revision is therefore easy, and diffing it against the present state is constant time (there's only one file).
Depending on your needs, it may not be a big deal that accessing 5000 revisions of history takes four or five seconds -- most developers probably don't do this more than once or twice a week.
A rough ordering would be: git, svn, hg, bzr, darcs.
commit-time-vs-files
The darcs people say that:
There are three directions in which a VC system can scale: having long histories, having a large source tree, and having large single commits.
The access-revision-time test exercises a VCS's ability to scale with long histories. The commit-time-vs-files test is meant to exercise the second direction: large source trees. It does this in a simpleminded way: each commit, add a new file. After the commit, do a "diff" command (i.e. "show me what files are changed": none have been since it's right after a commit).
The output columns are: addtime, committime, difftime, and diskusage.
As discussed in the README, a VCS's choice of file-check algorithm and add strategy can cause wildly varying results here. In other words, while the results presented in this section are "true", they may be meaningless, because most of the cost comes from reading unchanged files (or conversely saving time by not reading files because of their mtimes).
> plot.all.data("commit-time-vs-files-5000", "addtime")
> plot.all.data("commit-time-vs-files-5000", "committime", exclude=c("git-update"))
> plot.all.data("commit-time-vs-files-5000", "difftime")
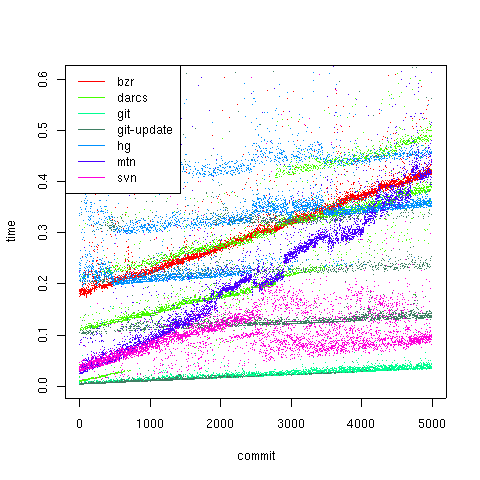
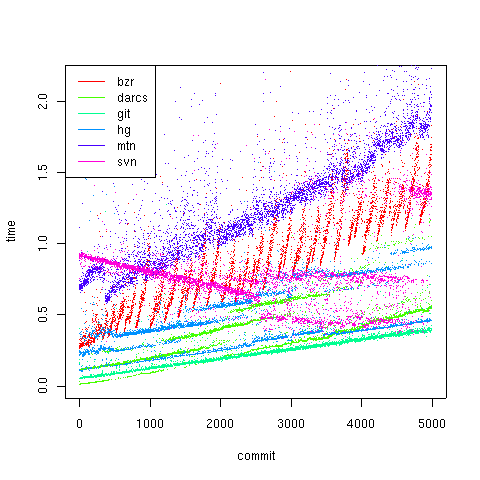
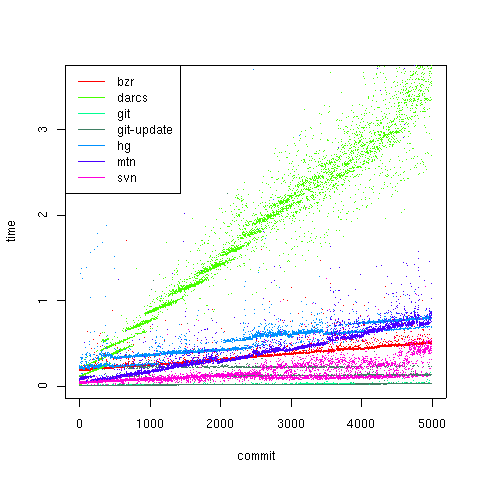
The difftime results seem to show git, followed by hg, bzr, and darcs. The committime results are all jumbled up, but I would guess that hg and darcs are faster than bzr and git. The addtime results show git faster than hg and darcs, and bzr trailing. All appear to have linear growth with the number of files.
When it comes to commits, darcs and hg assume that the files are the same for the majority of files. However, git's commits are very fast, because it doesn't even look at any files not explicitly added. bzr's performance is weird, bouncing all over up to about three seconds at the end.
You can compare the difftime results against the access-revision-history test's difftime4 results, if you are so inclined. Both tests have 5000 revisions of history, but difftime4 only has one file.
A rough ordering is: hg, darcs, svn, git, bzr, mtn.
> plot.all.data("commit-time-vs-files-5000", "diskusage")
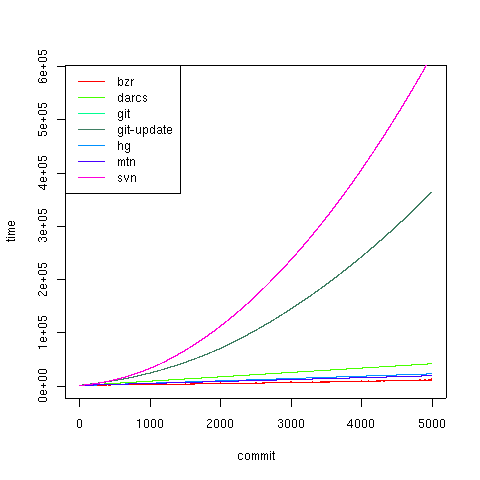
git and svn are clear losers here.
Note, however, that if you focus on the smaller systems:
> plot.all.data("commit-time-vs-files-5000", "diskusage", exclude=c("git", "svn"))
Both darcs and hg, being roughly changeset-based systems, have a constant size per revision. bzr, although its disk usage is small, I think has a slight upward curve to the diskusage graph, indicating that revisions with more files "weigh" more than revisions with small files. If this is true, eventually, bzr will overtake hg and darcs.
I also ran this test with the addstrategy=update option. This test should cause git to check all the files in the repository, as other VCSes are doing, on commit. However, diff, add, and diskusage should remain the same.
$ python Shootout.py git /tmp/wc commit-time-vs-files addstrategy=update commitstrategy=none num=5000 | tee commit-time-vs-files-5000/git-update.data
As you can see, it appears as though git-update is faster than git with the default lazy-add strategy, which calls git-add at the same time as it runs a commit. Presumably this means recomputing its SHA1. Using -a avoids this, but how it avoids checking all the other files in the directory I do not know.
A rough ordering appears to be: bzr, mtn, hg, and darcs, with git and svn trailing far behind.
access-revision-time-vs-file-size
> plot.all.data("access-revision-time-vs-file-size-5000/", "committime")
Interestingly, both hg and git have this weird banding in the results. My guess is that the disk access time is doing something weird for the file, and both systems are dominated by it. The results may be confounded by the fact that the files are lines of about a thousand characters; I think darcs doesn't handle this case well.